

Velocity is an excellent planning tool for longer projects and stable teams that are not very small. It allows you to ignore details like vacation and bad estimates. The law of averages smooths out the bumps allowing you to make a reasonable directional estimate of what can be achieved by a given date.
For smaller teams on short projects of four to six sprints the vanilla velocity does not work as well. If a developer goes on a two week vacation both the sprint capacity and release projection can be significantly off. In a recent case we needed a larger team to complete the project but the fifth member was not available until the third sprint. You can manually adjust for these situations but I prefer to automate when it saves time.
The workbook described below will give you the expected velocity and a graph with a projection of the completed scope using minimal data entry. Remember the output is as good as the input. Estimates are not predictions. Don’t over-interpret the numbers. I often show the graph at sprint reviews without numbers as a directional indicator.
The workbook consists of 4 (sets of) sheets:
- The Sprints Sheet which provides an overview of all sprints including capacity, expected and actual velocity.
- The Graph sheet which shows actual and estimated velocities, completed work and scope in one simple graph.
- One sheet for each sprint with details for that sprint. These sheets are used to estimate the sprint capacity for each sprint
- The Projections sheet which included the estimated scope and velocity. This is sheet is mainly used as the source for the Graph sheet
Please email me at jonathan.orgel@gmail.com for a copy of the template.
Sprint Sheet
The sprints sheet provides an overview of the sprints including capacity, accepted velocity, actual velocity and more. Most of the data is calculated. You only need to update the yellow cells.
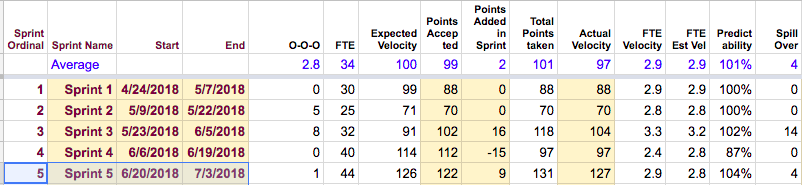
| Column | Notes |
| Sprint Ordinal | Shows the # if the sprint. Auto calculated |
| Sprint Name | This can be any string. Note that the sprint detail sheet must have the exact same name. |
| Start | Start date of the sprint. Typically the end date of the previous sprint +1 |
| End | End date of the sprint. For two weeks sprint start date + 13 |
| O-O-O | Number of person days team members are out of the office this sprint. From Sprint Detail Sheet. |
| FTE | Number of person days in this sprint. From Sprint Detail Sheet. |
| Expected Velocity | Expected velocity based on the average velocity and FTE this sprint. This is an indicator for the capacity of the team for this sprint. From Sprint Detail Sheet. |
| Points Accepted | Points accepted by the team at the start of the sprint |
| Points Added in Sprint | |
| Total Points taken | Sum of points accepted and points added |
| Actual Velocity | Number of points delivered at the end of the sprint |
| FTE Velocity | Velocity adjusted by Capacity. This allows the team to compare velocity from sprint to sprint |
| FTE Est Vel | The adjusted velocity needed to completed the accepted scope for this sprint |
| Predictability | If the team delivered as promised the predictability is 100%. If they produced more than it is bigger than 100%. |
| Spill Over | Number of points moved back to the backlog |
| Notes |
Sprint Detail Sheets
The sprint detail sheet helps both to estimate the capacity if the next sprint for sprint planning and to model the capacity for future sprints
Only edit the yellow cells.
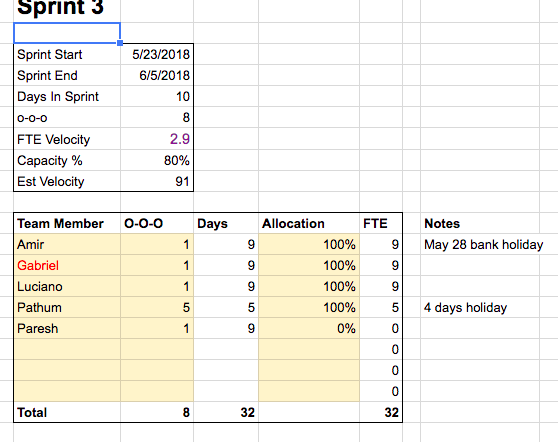
Capacity %: % of days team members are available due to planned time off
FTE Velocity: Average adjusted velocity for this team
Est Velocity: Estimated velocity based on the capacity and the FTE velocity
Team Member: Name of team member
O-o-o: Planned days out of office this sprint
Days: Days in sprint
Allocation: Adjustment for this team member based on his/her focus
FTE: Equivalent number of days this member contributes this sprint
The Graph Sheet
The graph sheet shows current, historic, and projected delivery in one graph. The graph may initially look intimidating but once the various components are clear it provides a quick overview of the project.
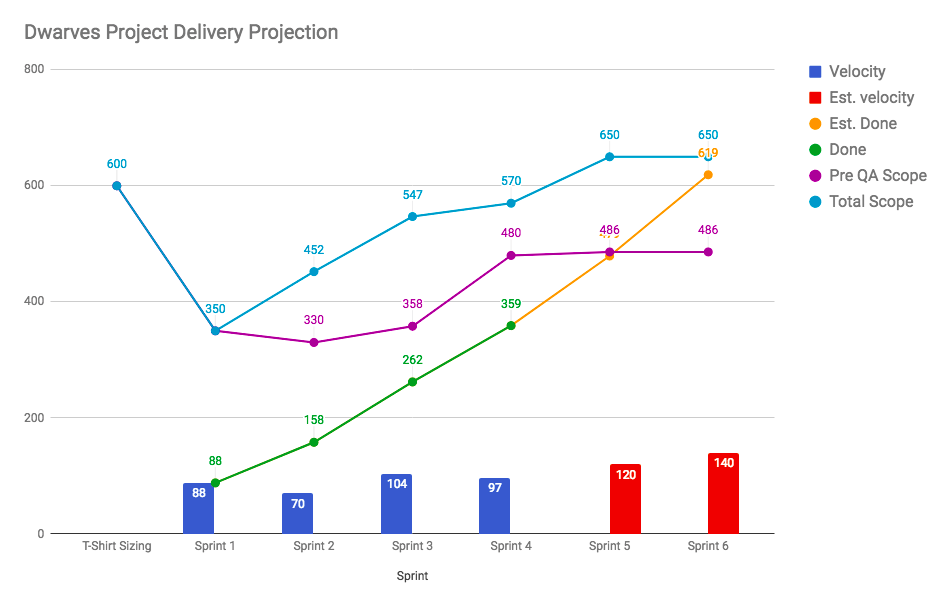
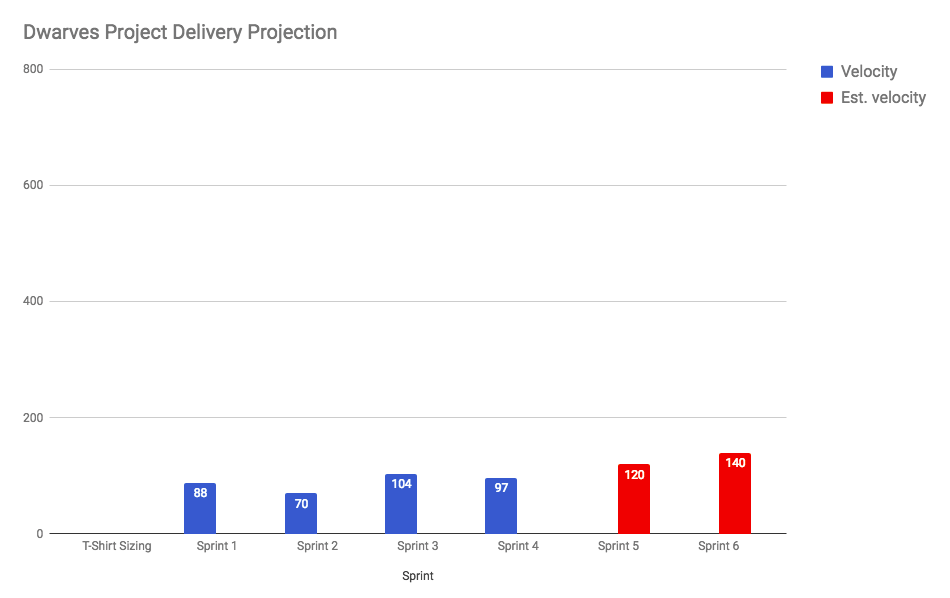
Current and Projected Velocity
The graph shows the velocity in story points of previous sprints in blue. Estimated future sprint velocity is shown in red.
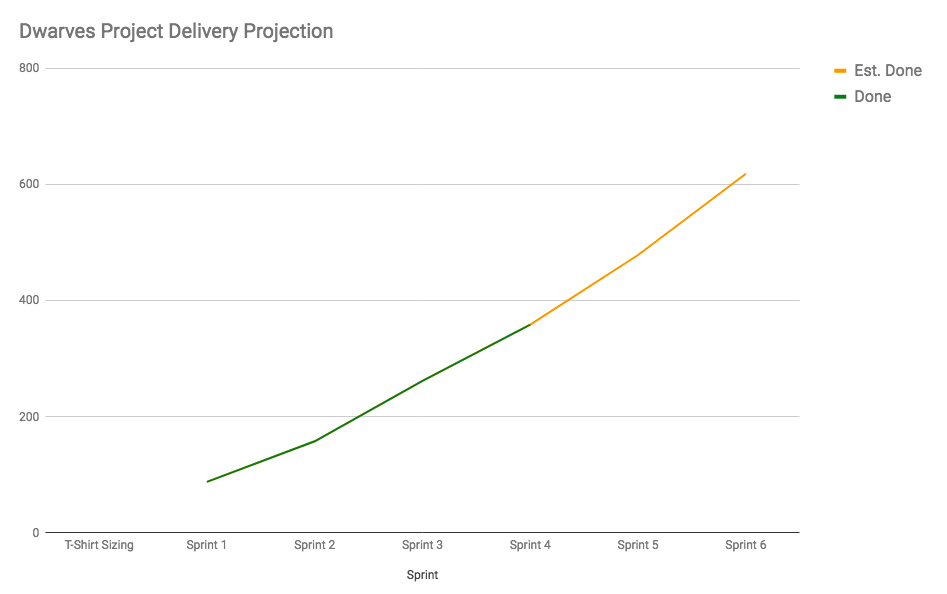
Completed and Estimated Completed Work
The green Done line shows the accumulated total number of points delivered after each sprint (the sum of the velocity of that sprint and all previous sprints)
The yellow Est. Done line shows the projected accumulated total number of points delivered after each future sprint (the sum of the estimated velocity of that sprint and all previous sprints)
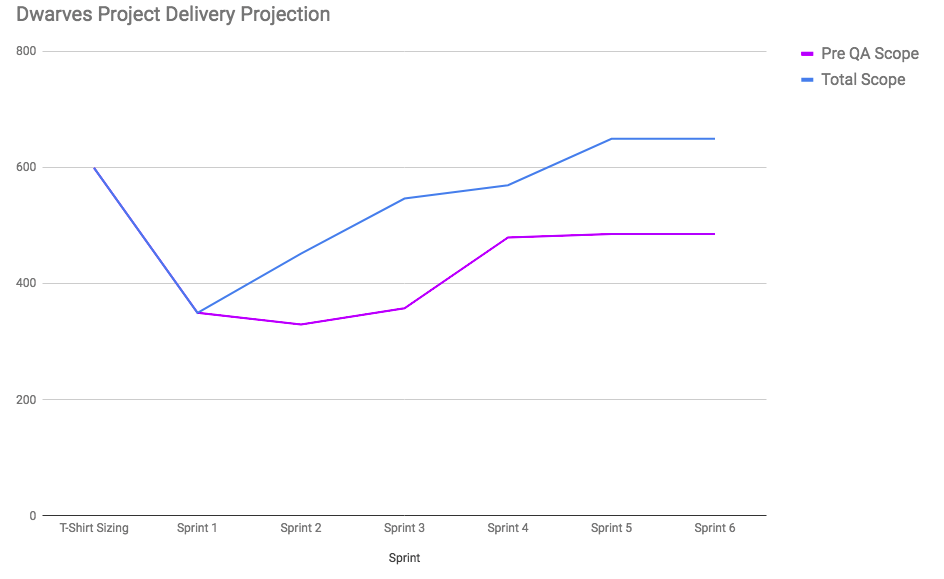
Scope
The scope line shows the estimated scope in points as it was known at the time of each sprint. The scope may change due to discovery of new work, and removal or acceptance of work based on the projected amount of work that can be done before the deadline. The scope line may also go up or down with constant scope if the estimates change.
If a project has two deadlines. E.g. Feature Code Freeze before a final platform QA stage and “all done” before delivery you may have two scope lines like in the graph below.
Data Source for Graph
The source for the graph is the Projections Sheet. Most of the data on this sheet are links to data on the sprints sheet. The only data to update in this sheet are the scope in points when they change. Just update the numbers for the next sprint and you are done.
By updating the scope for the sprint after the latest information was found we get a sense of how the scope and estimate cost of the scope has changed over time.
Only update the Yellow cells.

The graph is based on a burn-up chart Khal Ray shared with me at SRS Health.
The opinions represented in this blog are my own, and not that of my employer or the organizations that I work with.